TABLE 13-17
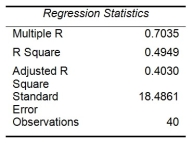
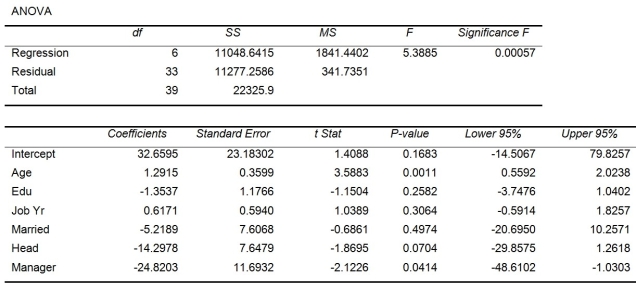
Given below are results from the regression analysis where the dependent variable is the number of weeks a worker is unemployed due to a layoff (Unemploy) and the independent variables are the age of the worker (Age), the number of years of education received (Edu), the number of years at the previous job (Job Yr), a dummy variable for marital status (Married: 1 = married, 0 = otherwise), a dummy variable for head of household (Head: 1 = yes, 0 = no) and a dummy variable for management position (Manager: 1 = yes, 0 = no). We shall call this Model 1.


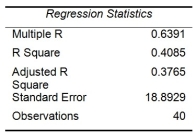
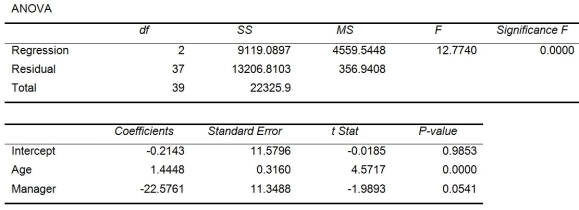
Model 2 is the regression analysis where the dependent variable is Unemploy and the independent variables are Age and Manager. The results of the regression analysis are given below:


-Referring to Table 13-17 Model 1, what is the p-value of the test statistic when testing whether being married or not makes a difference in the mean number of weeks a worker is unemployed due to a layoff, while holding constant the effect of all the other independent variables?
Definitions:
Standard Deviation
A measure of the amount of variation or dispersion in a set of values, indicating how much the individual data points differ from the mean.
Correlation
A gauge that measures the intensity of the relationship between two or more variables as they vary together.
Variability
The extent to which data points in a statistical distribution or data set diverge from the average or mean value.
Range
The difference between the highest and lowest scores in a set of data.
Q11: The gap between productivity and real hourly
Q13: Referring to Table 11-13, the critical value
Q15: Ashley was working as a part-time employee
Q16: Referring to Table 13-6, what can we
Q24: In which plan do employees possess the
Q38: Which of the following is a major
Q41: Prior to Juanita's first overseas assignment,she was
Q52: Referring to Table 14-3, suppose the analyst
Q109: Referring to Table 13-17 Model 1, predict
Q143: Referring to Table 13-3, the p-value for