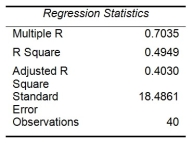
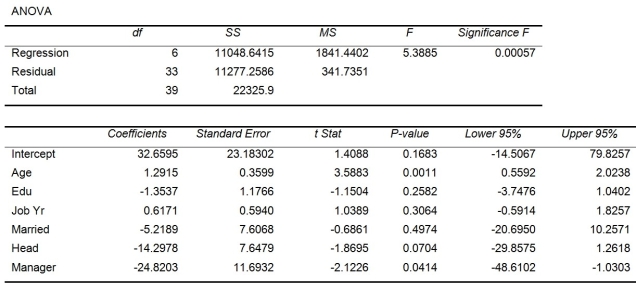
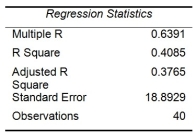
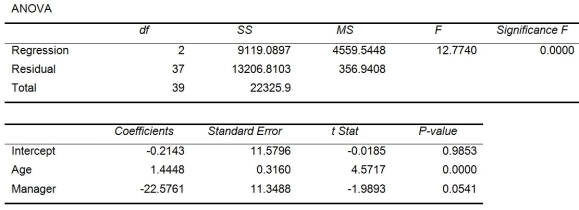
TABLE 13-17
Given below are results from the regression analysis where the dependent variable is the number of weeks a worker is unemployed due to a layoff (Unemploy) and the independent variables are the age of the worker (Age), the number of years of education received (Edu), the number of years at the previous job (Job Yr), a dummy variable for marital status (Married: 1 = married, 0 = otherwise), a dummy variable for head of household (Head: 1 = yes, 0 = no) and a dummy variable for management position (Manager: 1 = yes, 0 = no). We shall call this Model 1.


Model 2 is the regression analysis where the dependent variable is Unemploy and the independent variables are Age and Manager. The results of the regression analysis are given below:


-Referring to Table 13-17 Model 1, the null hypothesis should be rejected at a 10% level of significance when testing whether being married or not makes a difference in the mean number of weeks a worker is unemployed due to a layoff, while holding constant the effect of all the other independent variables.
Definitions:
Pseudoscience
A collection of beliefs or practices mistakenly regarded as being based on scientific method, but which do not adhere to a valid scientific methodology.
Psychological Language
The specialized vocabulary and terminology used in the field of psychology to describe mental processes, behaviors, and conditions.
Critical Thinkers
Individuals who engage in the process of logically analyzing and evaluating an issue or idea to reach a well-justified conclusion.
Flaws in Arguments
Logical fallacies or errors in reasoning that undermine the validity of an argument.
Q1: Which organization has the authority to define
Q7: Successful business endeavors rely on whom?<br>A)host country
Q25: Referring to Table 14-7, an R chart
Q25: The XYZ Co.took back performance-based compensation of
Q37: Expatriates receive _ allowances when the cost
Q81: The control chart<br>A) focuses on the time
Q124: Referring to Table 13-15, what is the
Q208: The coefficient of multiple determination, r², measures
Q222: Referring to Table 13-8, the value of
Q263: Referring to Table 13-3, the p-value for