TABLE 13-17
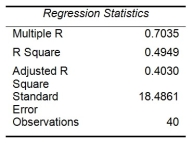
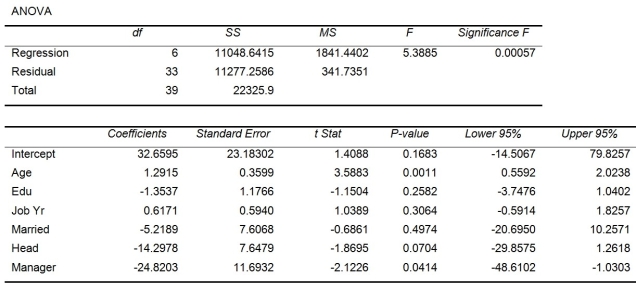
Given below are results from the regression analysis where the dependent variable is the number of weeks a worker is unemployed due to a layoff (Unemploy) and the independent variables are the age of the worker (Age), the number of years of education received (Edu), the number of years at the previous job (Job Yr), a dummy variable for marital status (Married: 1 = married, 0 = otherwise), a dummy variable for head of household (Head: 1 = yes, 0 = no) and a dummy variable for management position (Manager: 1 = yes, 0 = no). We shall call this Model 1.


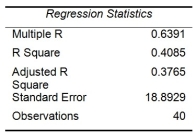
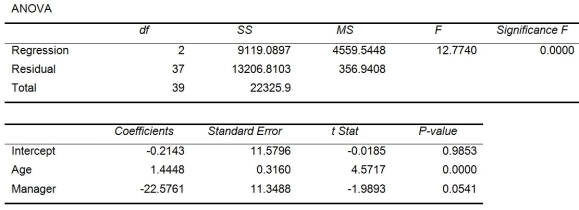
Model 2 is the regression analysis where the dependent variable is Unemploy and the independent variables are Age and Manager. The results of the regression analysis are given below:


-Referring to Table 13-17 Model 1, you can conclude that, holding constant the effect of the other independent variables, the number of years of education received has no impact on the mean number of weeks a worker is unemployed due to a layoff at a 5% level of significance if we use only the information of the 95% confidence interval estimate for β₂.
Definitions:
Alfred Russel Wallace
A British naturalist, explorer, geographer, anthropologist, and biologist known for independently conceiving the theory of evolution through natural selection.
Charles Darwin
A naturalist and biologist known for his theory of evolution through the mechanism of natural selection.
Pineal Body
Also known as the pineal gland, this small endocrine gland in the vertebrate brain secretes melatonin, regulated by light exposure.
Biological Rhythms
Internal cycles of biological activity within organisms, such as circadian rhythms, which influence sleep, feeding, and other physiological processes.
Q3: _ is the increase in prices for
Q8: Referring to Table 13-3, what is the
Q30: _ benefits allow for expatriates to take
Q51: A regression had the following results: SST
Q79: Referring to Table 12-3, set up a
Q84: The cause of variation that can be
Q111: Referring to Table 13-17 Model 1, what
Q127: Referring to Table 13-17 Model 1, the
Q192: The standard error of the estimate is
Q215: Referring to Table 13-15, predict the percentage