TABLE 14-3
A quality control analyst for a light bulb manufacturer is concerned that the time it takes to produce a batch of light bulbs is too erratic. Accordingly, the analyst randomly surveys 10 production periods each day for 14 days and records the sample mean and range for each day.
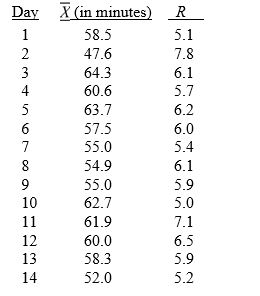
-Referring to Table 14-3, suppose the analyst constructs an R chart to see if the variability in production times is in control. What is the center line of this R chart?
Definitions:
Q26: Referring to Table 13-5, one company in
Q27: Safe harbor rules limit the number of
Q28: In 2022,how old will Cary have to
Q29: _ pay is defined as added pay
Q29: Which amendment to the U.S.Constitution made it
Q34: Who is responsible for compensating on-call employees?<br>A)independent
Q72: Variation due to the inherent variability in
Q147: Referring to Table 13-16, the error appears
Q168: Referring to Table 13-3, when the economist
Q278: Referring to Table 13-10, the standard error