TABLE 14-9
The manufacturer of canned food constructed control charts and analyzed several quality characteristics. One characteristic of interest is the weight of the filled cans. The lower specification limit for weight is 2.95 pounds. The table below provides the range and mean of the weights of five cans tested every fifteen minutes during a day's production.
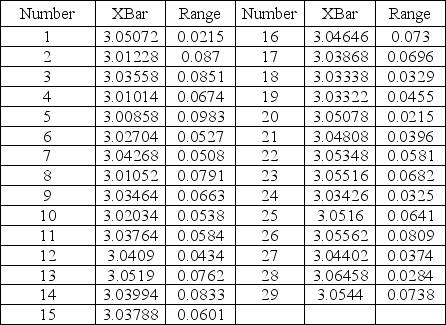
-Referring to Table 14-9, an R chart is to be constructed for the weight. One way to create the upper control limit involves multiplying the mean of the sample ranges by D₄. For this data set, the value of D₄ is ________.
Definitions:
Lorenz Curve
A graphical representation used to illustrate the distribution of income or wealth within a population, indicating inequality.
Equally Distributed
A situation or condition in which resources, wealth, or opportunities are shared evenly amongst all participants or members of a group.
Program
A set of planned activities or instructions designed to achieve a specific outcome, which can be implemented through software in computing or policy in government and organizations.
Lyndon Johnson
The 36th President of the United States, serving from 1963 to 1969, known for his domestic policies like the Great Society and civil rights advancement.
Q2: Person-focused pay programs depend,in large part,on well-designed
Q9: Which of the following would be considered
Q28: Referring to Table 14-8, based on the
Q30: Manufacturing is considered to be a _
Q37: Which of the following describes CEO compensation
Q37: This concept describes a company's success when
Q38: Under which three conditions are individual incentive
Q61: Referring to Table 13-13, the predicted demand
Q79: Which famous statistician developed the 14 Points
Q180: Referring to Table 12-10, the residual plot