Graph 17-1 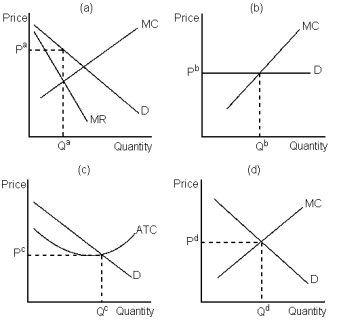
-Refer to Graph 17-1.Which of the following graphs would most likely represent a profit-maximising firm in a monopolistically competitive market?
Definitions:
Output Quantity
The total amount of goods or services produced by a company or country within a specific period.
Monopolistic Competition
A market structure characterized by many firms selling products that are similar but not identical, allowing for product differentiation.
ATC
Average Total Cost, which is the total cost divided by the quantity of output produced.
MR
Marginal Revenue is the additional income from selling one more unit of a good; sometimes equal to price.
Q2: A monopoly firm is able to charge
Q25: Dominant strategies in a two-person game often
Q31: When individual firms in competitive markets increase
Q61: If regulators want to allow monopolists to
Q144: Refer to Table 16-3.Since Robert and John
Q156: For a firm in a perfectly competitive
Q168: Perfect competition and monopolistic competition share the
Q180: A new brewing company announces that it
Q181: Firms that shut down in the short
Q196: When firms think at the margin and