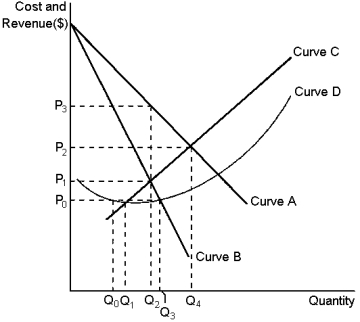
Graph 15-2  This graph reflects the cost and revenue structure for a monopoly firm.Use the graph to answer the following question(s) .
-Refer to Graph 15-2.The average-total-cost curve for a monopoly firm is depicted by curve:
Definitions:
Marginal Profit
The additional profit gained from producing or selling one more unit of a good or service.
Vertically Integrated
A business strategy where a company controls multiple stages of production within the same industry.
Transfer Price
The price at which goods or services are transferred between departments or subsidiaries within the same company.
Crude Oil
A naturally occurring, unrefined petroleum product composed of hydrocarbon deposits and other organic materials, used as a fuel and in the production of various chemicals.
Q13: Costs that have already been incurred and
Q53: When will a firm shut-down temporarily? When
Q87: The debate over whether society is wasting
Q122: Harry's Hotdogs is a small street vendor
Q127: Arbitrage is the process by which:<br>A)a good
Q128: Generic drugs enter the pharmaceutical drug market
Q137: Individual profit earned by Dave, an oligopolist,
Q142: Average total cost is equal to:<br>A)average variable
Q190: Price discrimination is a rational strategy for
Q198: At its current level of production, a