Graph 15-4 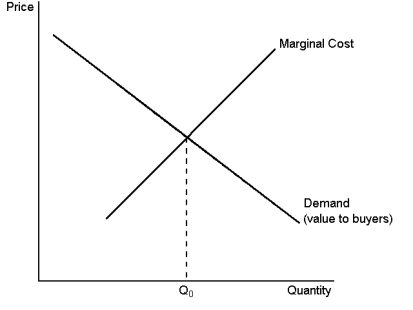 This graph depicts the demand and marginal-cost curves of a profit-maximising monopolist.Use the graph to answer the following question(s) .
-Refer to Graph 15-4.If the monopoly operates at an output level below q₀, decreasing output would:
Definitions:
Long-Run Average Total Cost
The average cost per unit of output in the long term when all inputs can be varied by the firm and economies of scale have been reached.
Output
The total amount of goods or services produced by a company, industry, or economy within a given period.
Returns to Scale
The rate at which output increases in response to a proportional increase in all inputs (factors of production).
Long-Run Average Total Cost Curve
A graphical representation showing the lowest possible average cost of production, allowing all factors of production to vary in order to minimize cost.
Q63: According to the information provided, if Black
Q79: According to the information provided, at the
Q115: Refer to Table 13-3.What is the marginal
Q127: Refer to Graph 13-5.Which of the curves
Q128: Refer to Graph 13-1.As the number of
Q140: The main reason that a monopolistically competitive
Q153: There are 500 profit-maximising firms in a
Q154: Suppose a movie theatre stays open late
Q163: Refer to Table 13-2.Adrienne has received an
Q186: The reason that monopoly remains a root-word