Graph 15-5 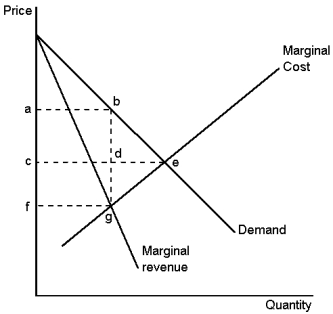 This graph depicts the demand, marginal-revenue and marginal-cost curves of a profit-maximising monopolist.Use the graph to answer the following question(s) .
-Refer to Graph 15-5.Which of the following areas represents the deadweight loss due to monopoly pricing?
Definitions:
National Business Ethics Survey
A research study that examines the ethical practices and attitudes within the business environment of a nation.
Q1: Refer to Graph 14-6.When market price
Q22: Refer to Table 15-1.What is the average
Q32: Which of the following statements concerning profit
Q48: Perfect price discrimination leads to zero consumer
Q76: A sawmill processes logs into timber.Identify the
Q88: Refer to table 14-3.Suppose the current market
Q92: Which of the following are barriers to
Q94: The resource cost of tax compliance is:<br>A)not
Q184: Consider the following graph <img src="https://d2lvgg3v3hfg70.cloudfront.net/TB8859/.jpg" alt="Consider
Q203: A monopoly's profit can be calculated as:<br>A)(Price