Graph 15-4 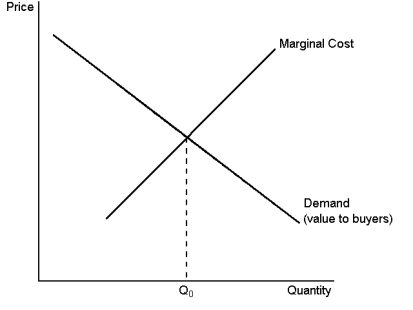 This graph depicts the demand and marginal-cost curves of a profit-maximising monopolist.Use the graph to answer the following question(s) .
-Refer to Graph 15-4.A benevolent social planner would cause the monopoly firm to operate at an output level:
Definitions:
Technology Changes
The process of innovation and the adoption of new or improved technologies and systems.
Demand For Labor
The total amount of hours of work that employers are willing to pay for at a given wage rate in the economy.
Marginal Physical Product
The additional output produced by employing one more unit of a specific factor of production, holding all other factors constant.
Marginal Revenue
The additional revenue earned by a firm for selling one more unit of a good or service, crucial for decision-making on production levels.
Q13: According to the information provided, advertising of
Q47: Because monopoly firms do not have to
Q55: A profit-maximising firm that is showing losses
Q66: Advertising during the Rugby World Cup is
Q86: Round-trip airline tickets are usually cheaper if
Q96: If a business is profitable from an
Q127: Refer to Graph 13-5.Which of the curves
Q155: A long-run supply curve that is more
Q157: Which of the following statements are most
Q161: Thirsty Thelma owns and operates a small