Graph 15-4 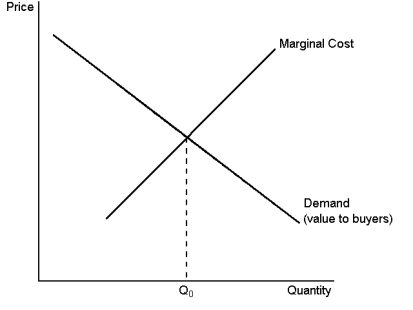 This graph depicts the demand and marginal-cost curves of a profit-maximising monopolist.Use the graph to answer the following question(s) .
-Refer to Graph 15-4.If the monopoly operates at an output level below q₀, decreasing output would:
Definitions:
NAV
Net Asset Value, the total value of a fund's assets minus its liabilities, divided by the number of shares outstanding.
Portfolio Turnover
A measure of how frequently assets within a portfolio are bought and sold by the manager over a specific period.
Front-end Load
A fee charged to investors when they purchase shares in a mutual fund, usually used to compensate brokers or sales agents.
Back-end Load
A fee charged to investors when they redeem shares from a mutual fund, typically used to compensate financial advisors.
Q25: If a perfectly competitive firm in equilibrium
Q36: Adult and concession prices for movie tickets
Q56: If rational, profit-maximising firms (like rational people)
Q70: Monopolistically competitive markets have all the desirable
Q117: The 'competition' in monopolistically competitive markets is
Q120: OPEC can be classified as which of
Q159: If a firm incurs fixed costs the
Q173: When a firm in a competitive market
Q176: The extra profit that a monopoly makes
Q188: Refer to the information provided.By its willingness