Graph 14-5 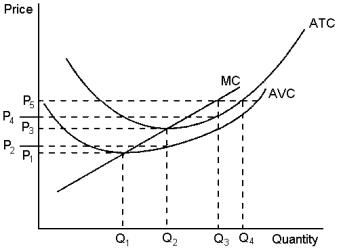 The graph depicts the cost structure of a firm in a competitive market.Use the graph to answer the following question(s) .
-Refer to Graph 14-5.When market price is P₂, a profit-maximising firm's losses can be represented by the area:
Definitions:
Paranoid Personality Disorder
A personality disorder characterized by persistent suspiciousness but not involving the disorganization of paranoid schizophrenia.
Suspicious
Characterized by a cautious distrust or skepticism about someone or something's motives or authenticity.
Trust
A psychological state or condition where an individual has confidence in the reliability, truth, or ability of someone or something.
Post-Traumatic Stress Disorder
A mental health condition triggered by experiencing or witnessing a traumatic event, characterized by flashbacks, nightmares, and severe anxiety.
Q1: The use of celebrity endorsements in advertising
Q27: Monopolistically competitive markets have two main sources
Q49: Critics of markets that are characterised by
Q58: A lump-sum tax has a marginal tax
Q82: Refer to the information provided.Consumer advocacy groups
Q97: If cutting down a native forest causes
Q107: In the Tragedy of the Commons, joint
Q174: Profit-maximising firms enter a competitive market when:<br>A)total
Q174: Refer to Graph 17-2.Which of the graphs
Q208: A monopolist is a price:<br>A)setter, and therefore