Graph 14-6 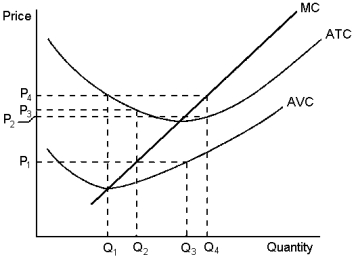 This graph depicts the cost structure of a firm in a competitive market.Use the graph to answer the following question(s) .
-Refer to Graph 14-6.When market price is P₁, a profit-maximising firm's total revenue can be represented by the area:
Definitions:
World Trade Organization
An international organization established to supervise and liberalize international trade, facilitating negotiation and enforcement of trade agreements among member countries.
North American Free Trade Agreement
A treaty among Canada, Mexico, and the United States that eliminated most tariffs and trade barriers between the countries, aiming to increase economic integration.
Corporate Welfare
Government support or subsidies to corporations including tax breaks, grants, and other financial incentives designed to support business interests.
Economic Planning
The process by which major economic decisions are made or influenced by central governments, including policies regarding the distribution of resources and national objectives.
Q3: Fill in the blanks.A monopolistically competitive firm,
Q60: If the government imposes a $2 tax
Q69: Which of these will always be the
Q140: One tax system is less efficient than
Q144: Refer to Graph 15-6.If the monopoly firm
Q148: One of the most important properties of
Q150: When a profit-maximising firm in a monopolistically
Q151: Refer to Graph 13-6.Which of the curves
Q154: Diminishing marginal product of labour is NOT
Q186: An appropriate way to measure the economic