Graph 14-5 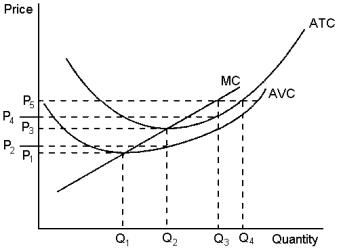 The graph depicts the cost structure of a firm in a competitive market.Use the graph to answer the following question(s) .
-Refer to Graph 14-5.When market price is P₂, a profit-maximising firm's losses can be represented by the area:
Definitions:
Average Variable Cost
Average variable cost is the total variable costs of production divided by the number of units produced, indicating the average cost of producing each unit excluding fixed costs.
Average Total Cost
The total cost of production divided by the total quantity produced, indicating the cost per unit of output.
Marginal Cost
A measure of the expense associated with manufacturing an additional item of a particular good.
Total Variable Cost
The sum of all variable costs (costs that change with the level of output) associated with producing a specific amount of a good or service.
Q10: There is little disagreement among people about
Q13: If a firm is in a competitive
Q27: Monopolistically competitive markets have two main sources
Q42: If people can be prevented from using
Q99: The profits that a monopoly makes are:<br>A)a
Q122: Harry's Hotdogs is a small street vendor
Q128: Property rights are important to solving some
Q163: Refer to Table 13-2.Adrienne has received an
Q168: Refer to Graph 15-6.Monopoly profit with perfect
Q195: Long-run economic profit in a monopolistically competitive