Graph 13-2 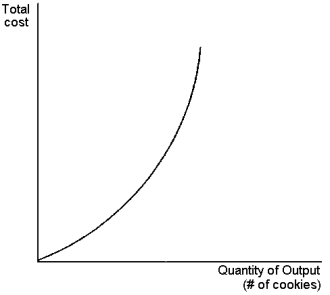 This graph depicts a total cost function for a firm that produces cookies.Use the graph to answer the following question(s) .
-Refer to Graph 13-2.Identify the true statements from the list below.(i) the marginal cost of cookie production is increasing
(ii) cookie production exhibits diminishing marginal product
(iii) the slope of the production function increases as quantity of inputs increase
Definitions:
Nonpersonal Selling
A promotional method using advertising, sales promotions, and other mass-market approaches to sell products, as opposed to direct, face-to-face sales.
Direct Marketing
A strategy involving direct communication with individual consumers to obtain an immediate response and cultivate lasting customer relationships.
Differentiate Products
The strategy of making a product stand out from its competitors by emphasizing its unique features or benefits.
Q9: Refer to Graph 13-6.At levels of output
Q27: The practice of selling the same goods
Q49: Kevin is a bricklayer in Melbourne.Bricklaying is
Q84: Suppose the government imposes a tax of
Q86: Round-trip airline tickets are usually cheaper if
Q104: Government can solve externality problems that are
Q115: One of the most pressing concerns associated
Q119: Profit-maximising producers in a competitive market in
Q134: If all citizens in a certain city
Q166: Negative consumption externalities will have a socially