Graph 13-5 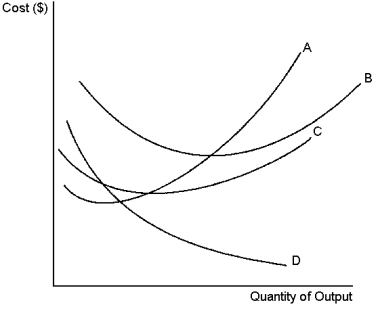 The set of curves above reflect information about the cost structure of a firm.Use this graph to answer the following question(s) .
-Refer to Graph 13-5.Which of the curves is most likely to represent marginal cost?
Definitions:
Output Level
The quantity of goods or services produced by a firm or economy over a certain period.
Marginal Revenue
The additional revenue a firm receives from selling one more unit of a product or service.
Marginal Cost
The expense associated with the next unit produced, emphasizing its role in production decisions and price setting.
Economic Profit
This is the difference between total revenue and total costs, including both explicit and implicit costs.
Q45: Using the above information, how much higher
Q53: When will a firm shut-down temporarily? When
Q56: If rational, profit-maximising firms (like rational people)
Q66: Refer to Graph 14-4.Which line segment best
Q72: The ocean remains one of the largest
Q91: Apparently, human life does have an implicit
Q104: How would a production function that exhibits
Q123: At low output levels a firm's average
Q127: A lighthouse is typically considered a good
Q136: Oil deposits are often considered a common