Multiple Choice
Graph 10-5 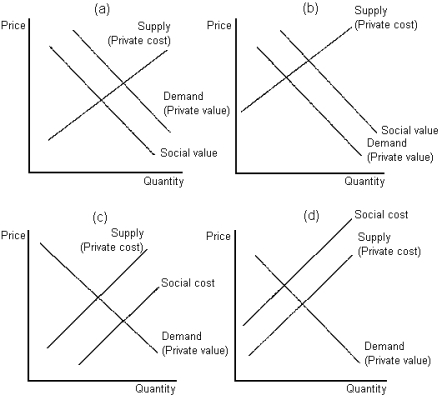
-Refer to Graph 10-5.Which of the graphs shown best depicts the case of a positive production externality?
Definitions:
Related Questions
Q1: A picnic table is an example of
Q10: A tariff and an import quota will
Q12: According to Graph 9-8, consumer surplus after
Q59: Lump-sum taxes:<br>A)are most frequently used to tax
Q64: According to Graph 9-4, producer surplus in
Q79: The effect of a tax on a
Q97: Many economists oppose the infant industry argument
Q107: In Graph 7-6, beyond the equilibrium quantity
Q175: Because the benefit each citizen receives from
Q179: Which of the following is true of