Solved
Graph 10-1 -Refer to Graph 10-1.Which Price and Quantity Combination Represents the Combination
Multiple Choice
Graph 10-1 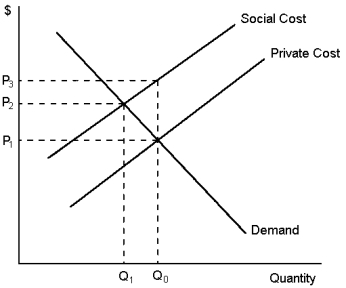
-Refer to Graph 10-1.Which price and quantity combination represents the social optimum?
Definitions:
Related Questions
Q10: There is little disagreement among people about
Q23: Private market failure to optimally allocate common
Q51: One of the important outcomes of international
Q80: According to the Coase theorem, parties will
Q93: Explain why the New Zealand 15% GST
Q121: According to Graph 8-3, the equilibrium market
Q130: Use an example to demonstrate the difference
Q133: The average total cost curve will be
Q135: The long-run average total cost curve is:<br>A)steeper
Q169: Internalising a positive production externality through technology