Multiple Choice
Graph 10-3 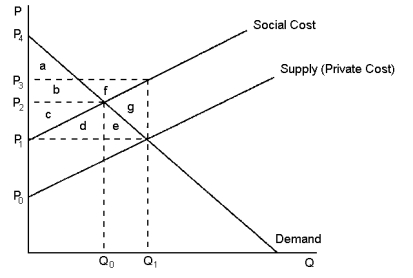 This graph reflects the market for kiwifruit, where pesticide used by kiwifruit orchardists also unintentionally kills honey bees.
-Refer to Graph 10-3.The difference between the social cost curve and the supply curve reflects the:
Definitions:
Related Questions
Q35: Charities are an example of a private
Q41: Government can internalise an externality by taxing
Q56: In a market characterised by externalities, the
Q69: A lighthouse might be considered a private
Q77: Assuming that Jane has the legal right
Q81: A good is rival if:<br>A)one person's use
Q82: Refer to Table 13-2.One week, Adrienne exactly
Q92: Economists disagree on the issue of how
Q124: According to this statement, if trade in
Q154: Company income is taxed three times: first