Multiple Choice
The figure below shows a graph of angular velocity as a function of time for a car driving around a circular track. Through how many radians does the car travel in the first 10 minutes? 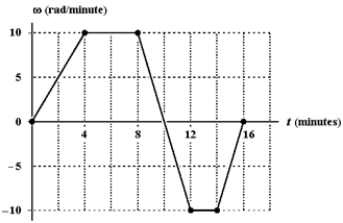
Definitions:
Related Questions
Q2: Assuming <span class="ql-formula" data-value="\frac{1}{2}"><span class="katex"><span
Q7: The law of conservation of momentum applies
Q8: The term <img src="https://d2lvgg3v3hfg70.cloudfront.net/TB8847/.jpg" alt="The term
Q8: _ backflow is a reversal of normal
Q11: If a person in Alaska were locked
Q12: One number has three significant figures and
Q15: A container having a volume of 1.0
Q18: In an elastic collision between two bodies
Q20: Indirect-fired water heaters use steam, hot water,
Q39: The motion of a particle connected to