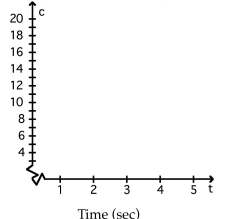
Estimate the value of the quantity.
-The table gives dye concentrations for a cardiac-output determination. The amount of dye injected was 5.0 mg. Plot the data and connect the data points with a smooth curve. Find the Area under the curve using rectangles. Use this area to estimate the cardiac output.

Definitions:
Indifference Curves
Graphical representations in economics showing different combinations of two goods that provide the same level of satisfaction or utility to a consumer.
L-shaped
Referring to a graph shape, usually indicative of certain economic recovery patterns, representing a rapid fall followed by a prolonged period of stagnation.
Indifference Curves
Graphical representations in microeconomics to illustrate different combinations of two goods that provide a consumer with the same level of satisfaction or utility.
Equation
A mathematical statement that asserts the equality of two expressions, typically used in modeling economic relationships.
Q8: <span class="ql-formula" data-value="x y ^ { \prime
Q12: <span class="ql-formula" data-value="f ( x ) =
Q19: Find equations of all tangents to
Q31: It is legally and ethically defensible for
Q34: <span class="ql-formula" data-value="\int \sec ^ { n
Q39: If an officer is corrupt, unfair, prejudiced,
Q41: <span class="ql-formula" data-value="\frac { d y }
Q68: A piece of tissue paper is
Q98: <img src="https://d2lvgg3v3hfg70.cloudfront.net/TB8583/.jpg" alt=" A) No absolute
Q183: The velocity of water <span