The following information relates to Questions
daniela ibarra is a senior analyst in the fixed-income department of a large wealth manage-ment firm. Marten Koning is a junior analyst in the same department, and david lok is a member of the credit research team.
The firm invests in a variety of bonds. ibarra is presently analyzing a set of bonds with some similar characteristics, such as four years until maturity and a par value of €1,000. exhibit 1 includes details of these bonds.
exhibit 1 a brief description of the bonds being analyzed bond descriptionb1 a zero-coupon, four-year corporate bond with a par value of €1,000. The wealth management firm's research team has estimated that the risk-neutral probability of default (the hazard rate) for each date for the bond is 1.50%, and the recovery rate is 30%.b2 a bond similar to b1, except that it has a fixed annual coupon rate of 6% paid annually.
b3 a bond similar to b2 but rated aa.
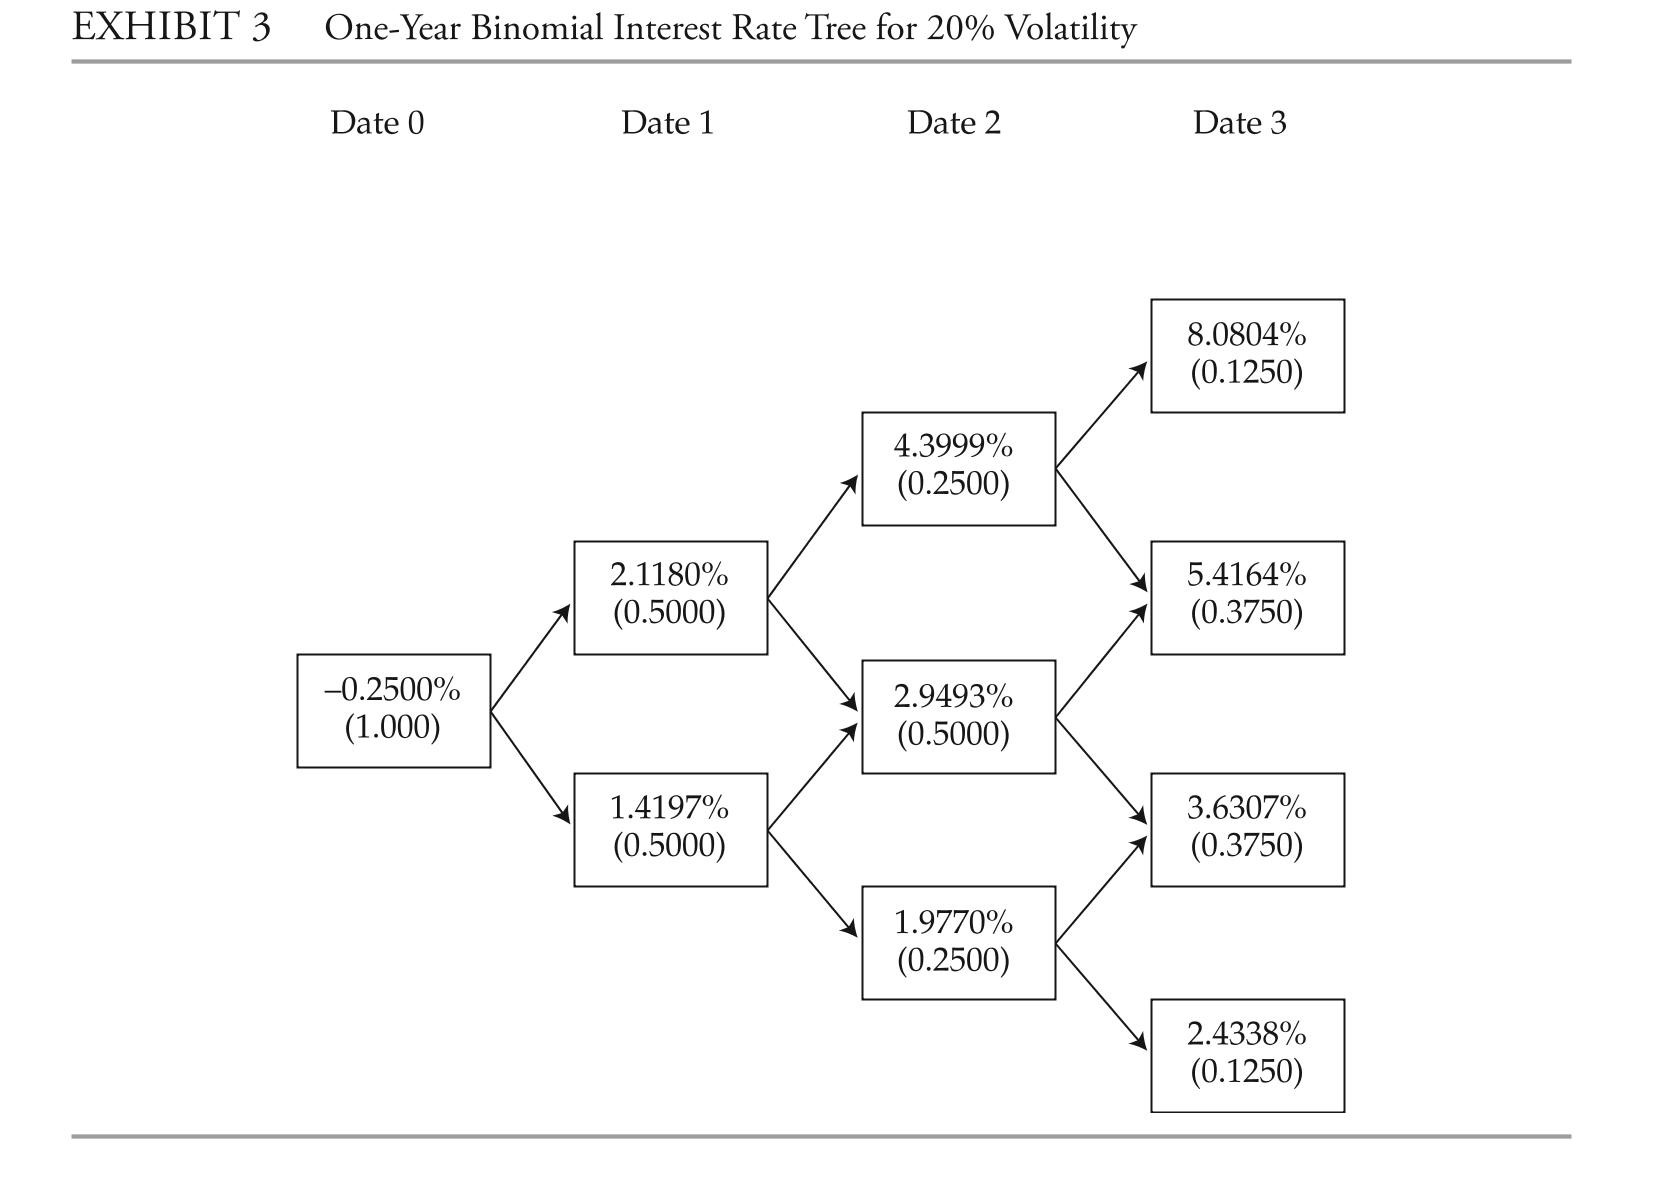
b4 a bond similar to b2 but the coupon rate is the one-year benchmark rate plus 4%.ibarra asks Koning to assist her with analyzing the bonds. She wants him to perform the analysis with the assumptions that there is no interest rate volatility and that the government bond yield curve is flat at 3%.ibarra performs the analysis assuming an upward-sloping yield curve and volatile interest rates. exhibit 2 provides the data on annual payment benchmark government bonds.1 She uses these data to construct a binomial interest rate tree (shown in exhibit 3) based on an assump-tion of future interest rate volatility of 20%.
1 For simplicity, this exhibit uses
 answer the first five questions (1-4) based on the assumptions made by Marten Koning,the junior analyst. answer questions (8-12) based on the assumptions made by daniela ibarra, the senior analyst.
Note: all calculations in this problem set are carried out on spreadsheets to preserve reci-sion. The rounded results are reported in the solutions.
-as previously mentioned, ibarra is considering a future interest rate volatility of 20% and an upward-sloping yield curve, as shown in exhibit 2. based on her analysis, the fair value
Of bond b2 is closest to:
Definitions:
Commodity Chain
The network of production and labor processes by which a product becomes a finished commodity. By following the commodity chain, it is evident which countries gain profits and which ones are being exploited.
Division of Labor
The allocation of different tasks to different people or groups in a society, contributing to economic efficiency and specialization.
Core Nations
Countries that dominate global trade and economics, often through technological advancement and wealth.
Peripheral Countries
Nations that are less developed than the semi-peripheral and core countries, often characterized by low levels of industrialization, and significant economic dependence on core countries.
Q2: Find the center and vertices of
Q3: Evaluate the following expression. <span
Q3: the moment of force <span
Q5: is Perreaux correct with respect to key
Q7: based on the given Z-spreads for bonds
Q10: Based on Exhibit 1, which key rate
Q19: relative to domestic and foreign bonds, eurobonds
Q20: in contrast to high-yield credit analysis, investment-grade
Q29: The bond's yield-to-worst is closest to:<br>A) 2.88%.<br>B)
Q36: Select the graph of the following