Multiple Choice
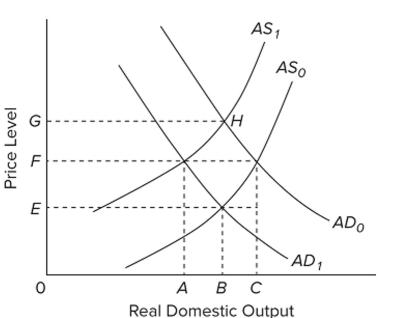
Refer to the diagram. If the aggregate supply curve shifted from AS0 to AS1 and the aggregate demand curve remains at AD0, we could say that
Definitions:
Related Questions
Q24: SA=−20 + 0.4Y <br>Ig = 25 −
Q64: <span class="ql-formula" data-value="\begin{array} { | c |
Q163: If the cost of resources decreases, then
Q194: The operational lag of fiscal policy refers
Q208: The aggregate demand curve<br>A) is upsloping because
Q217: The relationship between consumption and disposable income
Q247: The portion of the public debt owed
Q287: What percentage of the average U.S. firm's
Q318: <img src="https://d2lvgg3v3hfg70.cloudfront.net/TB8601/.jpg" alt=" A) a reduction
Q333: A specific reduction in government spending will