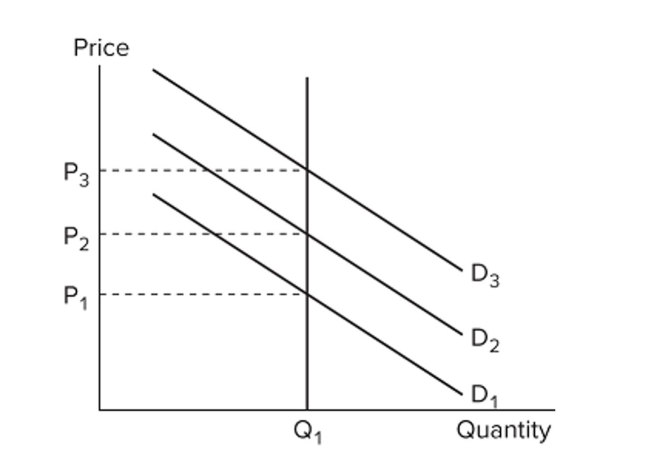
 The figure depicts a situation where
Definitions:
Inferior Goods
A good that has a negative income elasticity, so that as consumer income rises, the demand for the good falls.
Normal Goods
Goods for which demand increases as the income of individuals increases.
Demand Curve
A graphical representation of the relationship between the price of a good or service and the quantity demanded for a given period.
Normal Goods
Goods for which demand increases when income increases, and falls when income decreases, but price remains constant.
Q23: At the end of the summer driving
Q32: National income is the sum of employee
Q37: Rent-seeking behavior in public choice theory refers
Q68: The following data are for a
Q75: If intermediate goods and services were included
Q81: Economic historians identify which invention as a
Q109: What is meant by human capital and
Q118: The value of U.S. imports is<br>A) added
Q134: Suppose total output (real GDP) is $10,000
Q188: Which of the following is a measure