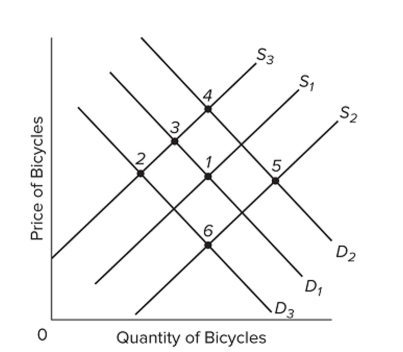
 Refer to the above graph, which shows the market for bicycles. S1 and D1 are the original supply and demand curves. D2 and D3 and S2 and S3 are possible new demand and supply curves. Starting
From the initial equilibrium (point 1) , which point on the graph is most likely to be the new equilibrium
After the introduction of technological improvements in bicycle production and successful publicity
Campaigns by the government on the virtues of bicycling to work?
Definitions:
Long-run Equilibrium Price
The price at which the quantity of a good demanded equals the quantity supplied, with all adjustments made for factors affecting supply or demand over time.
Product Demand
The desire and willingness of consumers to purchase a particular product at various prices during a certain period.
Purely Competitive Firm
A business functioning in an environment with numerous purchasers and vendors, where no single entity has the power to notably affect the prices in the market.
Technological Improvement
Advances and innovations in technology that enhance efficiency, productivity, or capabilities in various sectors.
Q2: All of the following are considered a
Q8: Assuming all sensory, motor, and reflex neuronal
Q11: Which disorder is associated with dysfunction of
Q42: <img src="https://d2lvgg3v3hfg70.cloudfront.net/TB8601/.jpg" alt=" Refer to the
Q57: Suppose that goods A and B are
Q76: Which is one of the five fundamental
Q83: The figure below shows three demand curves
Q105: <span class="ql-formula" data-value="\begin{array} { | c |
Q157: eBay and Amazon provide "sellers' ratings" information
Q162: An increase in the equilibrium quantity of