The diagrams represent various states of abnormal hydration. In each diagram, the normal state (solid lines) is superimposed on the abnormal state (dashed lines) to illustrate the shifts in the volumes (width of rectangles) and total osmolarities (height of rectangles) of the extracellular fluid and intracellular fluid compartments.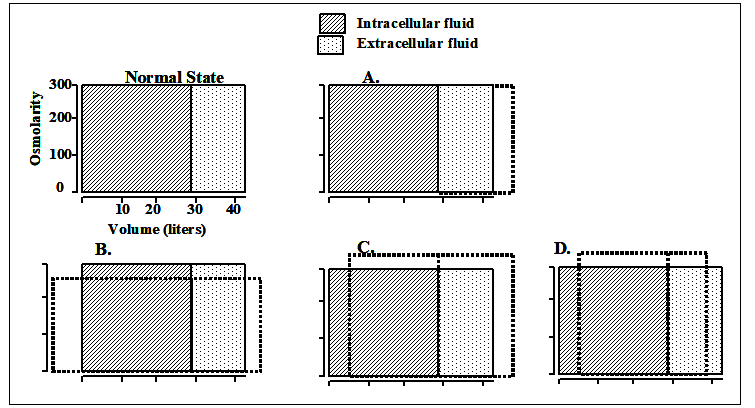
-Which of the diagrams would represent the changes (after osmotic equilibrium) in extracellular and intracellular fluid volumes and osmolarities after infusion of 3.0% sodium chloride (molecular weight of dextrose = 58.5 g/mol) ?
Definitions:
P Value
A statistical measure that helps scientists determine the significance of their research results, reflecting the likelihood that the observed data could occur by chance.
Mean
A statistical measure that represents the arithmetic average of a set of numbers.
Statistically Significant
A term used to describe a result that is unlikely to have occurred by chance alone, according to a predetermined threshold of probability.
Variation
The occurrence of differences among individuals within a population, due to genetic differences or environmental factors.
Q1: What event occurs at point A in
Q1: Which of the following best describes the
Q1: A patient was admitted to the local
Q2: Under low or reduced light conditions, which
Q2: Which of the following is the most
Q3: Which of the following decreases the risk
Q3: A nonacclimatized person is breathing air at
Q7: Selective bilateral damage to the gray ramus
Q14: A man fell asleep in his
Q22: In a person on a very