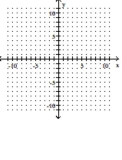
Choose the one alternative that best completes the statement or answers the question.
Graph the linear equation.
- 
Definitions:
Decision Tree
A decision tree is a graphical representation used to visualize the choices in a decision-making process, their possible outcomes, chance event results, and resource costs, aiding in analysis and planning.
Graphic Representation
A visual method of displaying information or data, such as charts, diagrams, or maps.
Equal Probability
refers to the principle that every outcome in a given sample space has the same chance of occurring.
Certainty
The state of being sure or confident about something, often used in decision-making scenarios where outcomes can be predicted with high accuracy.
Q21: <span class="ql-formula" data-value="x ^ { 2 }
Q31: <span class="ql-formula" data-value="f ( - 1 )"><span
Q33: A ladder is resting against a wall.
Q49: <span class="ql-formula" data-value="8 y + 8 x
Q56: The population of a small country
Q62: <span class="ql-formula" data-value="5 r ^ { 2
Q70: <span class="ql-formula" data-value="f ( x ) =
Q70: 597.08<br>A) <span class="ql-formula" data-value="5.9708 \times
Q72: <span class="ql-formula" data-value="\frac { 1 } {
Q86: <span class="ql-formula" data-value="\frac { k ^ {