Solve the problem.
-An accountant tabulated a firm's profits for four recent years in the following table:
The accountant then fit both a linear graph and an exponential curve (seen below) to the data, in order to estimat profits. Use the linear graph to estimate the profits in the year 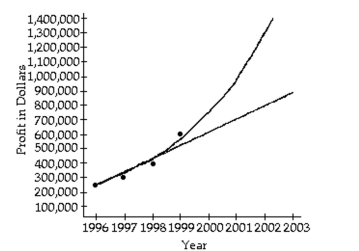
Definitions:
Q27: <span class="ql-formula" data-value="f ( x ) =
Q34: <span class="ql-formula" data-value="630,000"><span class="katex-display"><span class="katex"><span class="katex-mathml"><math xmlns="http://www.w3.org/1998/Math/MathML"
Q36: <span class="ql-formula" data-value="f ( x ) =
Q44: 2.7, 4.7, 8.5, 3.5<br>A)3.5<br>B)4.7<br>C)4.1<br>D)8.5
Q59: <span class="ql-formula" data-value="h + \frac { 1
Q70: <span class="ql-formula" data-value="( - 4,6 )"><span class="katex"><span
Q116: <span class="ql-formula" data-value="2 x ^ { 3
Q169: Wang Company had the following transactions during
Q197: On April 1 2022 nPropel Corporation paid
Q201: The balances of the Depreciation Expense and