Diagram 1
-Refer to Diagram 2 above.Shifting the aggregate supply curve to the right
Definitions:
Actual Inflation
The real rate at which the general level of prices for goods and services is rising, and, subsequently, purchasing power is falling.
Natural Rate
The level of any economic factor, such as unemployment or interest rates, that is unaffected by short-term fluctuations and is determined by long-term factors.
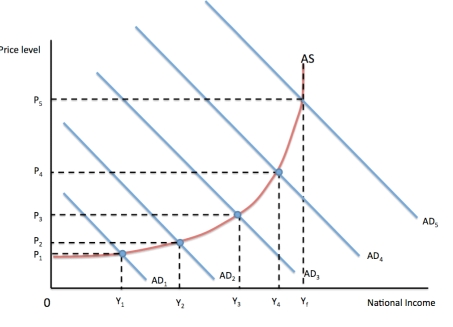
Aggregate-Supply Curve
A curve that shows the quantity of goods and services that firms choose to produce and sell at each price level
Trade-Off
An exchange where getting something of value requires giving up something else of value, typically used in the context of making decisions with limited resources.
Q4: Higher tax rates<br>A)reduce the opportunity cost of
Q11: When more rands are needed to buy
Q17: The major cost to the UK of
Q26: Use the money market to explain the
Q28: Deregulation refers to the rules placed on
Q34: If data exhibits a trend that is
Q36: Suppose the nominal interest rate is 7
Q54: While taxes distort market outcomes, welfare payments
Q61: A set of documented guidelines for moral
Q68: This document system is a pictorial representation