Using the graph below, in which the vertical distance between points A and B represents the tax in the market, answer the following questions:
a. What was the equilibrium price and quantity in this market before the tax?
b. What is the amount of the tax?
c. How much of the tax will the buyers pay?
d. How much of the tax will the sellers pay?
e. How much will the buyer pay for the product after the tax is imposed?
f. How much will the seller receive after the tax is imposed?
g. As a result of the tax, what has happened to the level of market activity?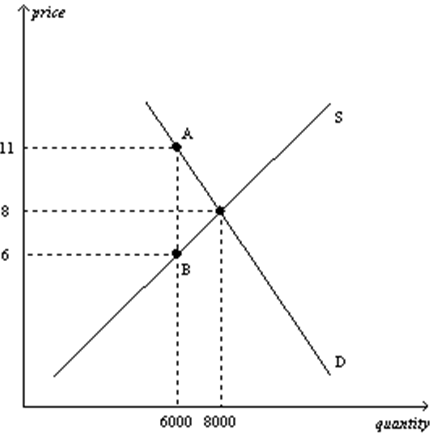
Definitions:
Acquisition-Date Fair Value
The value of an asset or liability estimated at the date of acquisition based on its current market value.
Intra-Entity Debt Transactions
Financial obligations or loans between entities within the same corporate group, not necessarily evidenced in consolidated financial statements until settled externally.
Amortization Process
The systematic reduction of a loan or the spreading out of capital expenses over a fixed period of time.
Investment Account
An account holding securities, cash, and other assets managed by an investment dealer or manager for the benefit of the investor.
Q5: The isocost line measures the different combination
Q7: What is the difference between a "change
Q12: Which of the following is <b>NOT</b> a
Q19: If the supply curve is perfectly price
Q23: Under what conditions might government intervention in
Q24: Economists make assumptions in order to<br>A) mimic
Q25: Which of the following firms is most
Q35: If consumers think that there are very
Q36: In general, a flatter demand curve is
Q58: Suppose each of 20 neighbours on a