Multiple Choice
The figure given below depicts the foreign exchange market for British pounds traded for U.S. dollars.
Figure 21.2
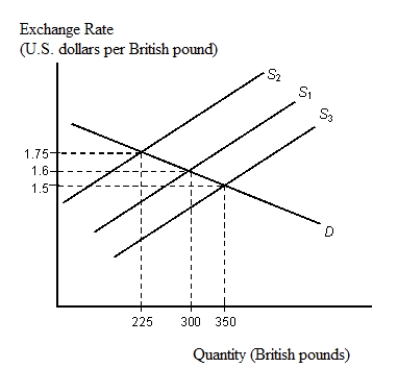
-Refer to Figure 21.2. At the initial equilibrium point, with demand curve D and supply curve S1:
Definitions:
Related Questions
Q2: What three factors combine to create the
Q9: Refer to Scenario 20.1. What is the
Q30: If real GDP for Mexico was 19.8
Q33: In Figure 20.3, if the world price
Q45: In order to protect key industries, some
Q59: Countries with a relatively high stock of
Q75: Suppose, in the United States, each farmer
Q80: Refer to Figure 18.1. Assume that there
Q97: Refer to Figure 21.2. Suppose S1 is
Q115: The exchange-rate arrangement that emerged from the