The figure given below depicts the demand and supply of Brazilian reals in the foreign exchange market. Assume that the market operates under a flexible exchange rate regime.
Figure 21.1
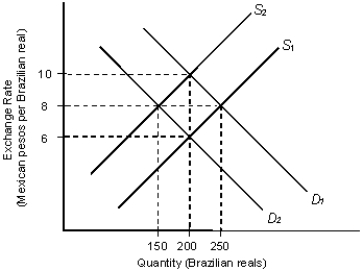
In the figure:
D1 and D2: Demand for Brazilian reals
S1 and S2: Supply of Brazilian reals
-Refer to Figure 21.1. Determine the equilibrium exchange rate and equilibrium quantity of Brazilian reals, if D1 and S1 are the relevant demand and supply curves for Brazilian reals in this market.
Definitions:
Federal Spending
The total amount of money spent by the national government on various programs, services, and initiatives.
Borrowing
The act of obtaining funds from another party with the promise to repay the principal amount along with interest or dividends.
Economic Growth
An increase in the production of goods and services in an economy over a period, often measured as the percent rate of increase in real GDP.
OECD
An international organization (Organisation for Economic Co-operation and Development) that promotes policies to improve the economic and social well-being of people around the world.
Q15: _ is an approach that brings together
Q22: Whether exchange is between individuals, firms, or
Q24: International trade financing is dominated by:<br>A) the
Q28: For most Third World countries, the key
Q39: Which of the following is considered a
Q53: We know that industrial countries tend to
Q67: According to Table 20.5, the international equilibrium
Q69: All of these are essential entrepreneurial characteristics
Q82: Entrepreneurs who aspire to start an online
Q86: Suppose the official gold value of the