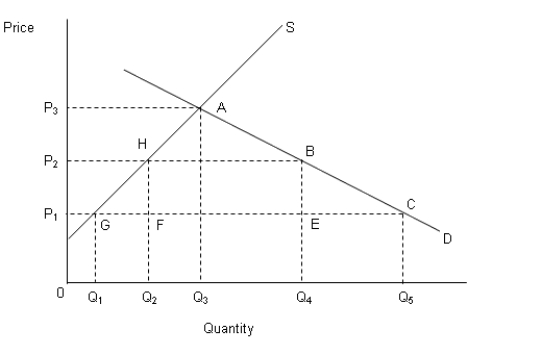
The figure below shows the demand (D) and supply (S) curves of a good produced domestically in an economy as well as traded in the international market.
Figure 20.1
 In the figure,
P1: Price of the good in the international market.
P2: Price of the good in the domestic market after the imposition of tariff by the government.
P3: No-trade price of the good in the domestic market.
-Refer to Figure 20.1. If the government imposes a tariff such that the price of the good in the domestic market is P2 while the international price is P1, the dollar value of the tariff is equal to:
Definitions:
Q1: A company's top management is exclusively made
Q4: Under a fixed exchange-rate system, in order
Q32: According to Figure 20.2, the international equilibrium
Q49: _ uses a formal bargaining process to
Q71: A document specifying the business details prepared
Q74: Suppose a U.S. firm buys a one-year
Q75: The first stage of growth for an
Q79: Entrepreneurs in the sustainer category are rewarded
Q103: According to Table 20.2, Australia has:<br>A) a
Q106: The dollar return on a foreign investment