Multiple Choice
The figure given below depicts the negatively sloped demand and positively sloped supply curves of wheat in a country.
Figure 20.2
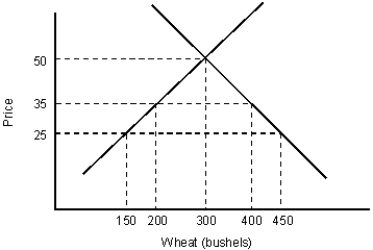
-In Figure 20.2, if the world price of wheat is $35 and a $15 tariff is imposed:
Definitions:
Related Questions
Q8: In Figure 20.2, if the world price
Q10: Which of the following measures of globalization
Q12: Economists typically date the beginning of the
Q46: Refer to Figure 21.2. An increase in
Q52: _ implies that women's commitment to their
Q57: It has been proved empirically that globalization
Q60: In the 1990s, foreign direct investment had
Q80: Change, according to Kurt Lewin, is a
Q100: Define a corporation and briefly discuss the
Q100: Refer to Scenario 20.1. Which of the