The figure given below represents the new classical long run and short run Phillips curve measuring inflation rate on vertical axis and unemployment rate on horizontal axis.
Figure 15.2
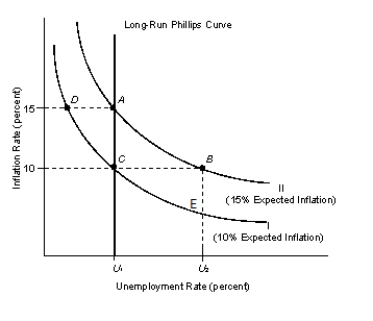
-Refer to the Figure 15.2. Assume the economy is currently at point C. According to the new classical school, an expected increase in government spending:
Definitions:
Organic Fertilizer
A type of fertilizer made from natural organic materials, such as compost, manure, or bone meal, which enriches soil fertility without the use of synthetic chemicals.
Manufacturer
A person or company that makes goods for sale through the process of combining raw materials and components.
Net Operating Income
The profit generated from a company's regular business operations, excluding expenses and revenues from non-operating activities.
Monthly Sales
Monthly sales represent the total revenue or units sold by a business within a calendar month, often used to gauge performance and trends.
Q6: Suppose that the economy grows by 4
Q21: To follow an outward-oriented strategy, a country
Q29: Which of the following stands true for
Q34: New classical economists advocate less government intervention
Q55: The Federal Open Market Committee consists of:<br>A)
Q56: _ is the theory that was popular
Q76: Which of the following can be categorized
Q77: A sudden technological breakthrough in an economy
Q85: Countries that have a large number of
Q93: Monetarists argue that government actions, particularly monetary