The figure given below represents the short run and long run Phillips curve.
Figure 14.4
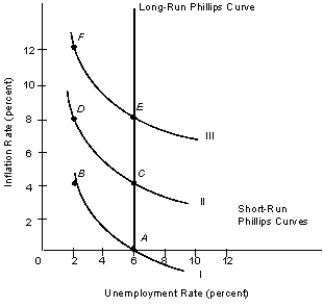
-Refer to Figure 14.4. Suppose the economy is located at point A, but the government increases spending because it believes that 6 percent unemployment is unacceptably high. If the adaptive expectations hypothesis holds, in the short run, the economy will move to:
Definitions:
Q21: New classical economists believe that:<br>A) market failure
Q24: International trade financing is dominated by:<br>A) the
Q42: Assume an economy has automatic stabilizers in
Q63: An inward-oriented strategy is designed to:<br>A) expand
Q72: Which of the following is true of
Q78: In the Keynesian region of the aggregate
Q78: Assume we are at an income level
Q83: Excess reserves are equal to:<br>A) total reserves
Q90: Which of the following statements applies to
Q125: By Gresham's law, commodity money will always