The figure given below depicts the equilibrium exchange rate between the U.S dollar and the Mexican peso.
Figure 13.2
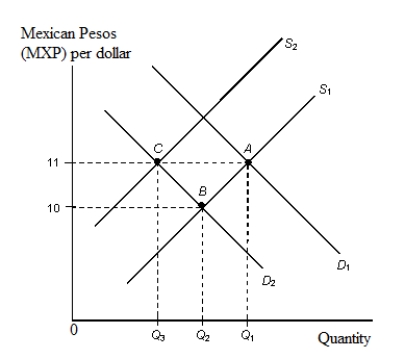
-Refer to Figure 13.2. Given a target exchange rate of MXP 11 = $1 with S1 the relevant supply curve and a decline in Mexican demand for U.S. dollars from D1 to D2 the Fed intervenes in the foreign exchange market by:
Definitions:
Smooth Functioning
Describes a situation where processes operate without interruption, often related to the seamless operation of systems or organizations.
Federal Minimum Wage
The lowest legal hourly pay for many workers in the United States, set by federal law.
Labor Market
Refers to the economic space where workers offer their services and employers seek to hire labor, characterized by the negotiation of wages, hours, and working conditions.
Unemployment
A measure of the number of people who are actively looking for work but are not currently employed.
Q6: A key reason for low foreign direct
Q11: Bilateral aid is foreign aid that:<br>A) goes
Q22: Which of the following is assumed to
Q27: If aggregate expenditures are less than real
Q30: If real GDP for Mexico was 19.8
Q50: The recessionary gap is given by the
Q51: The income net of taxes is called
Q55: The euro is a composite currency; its
Q115: Refer to Figure 14.2. If the natural
Q119: When do we say that a bank