In the figure given below panel A represents money market equilibrium, panel B represents investment demand, and panel C represents equilibrium real GDP.
Figure 13.3
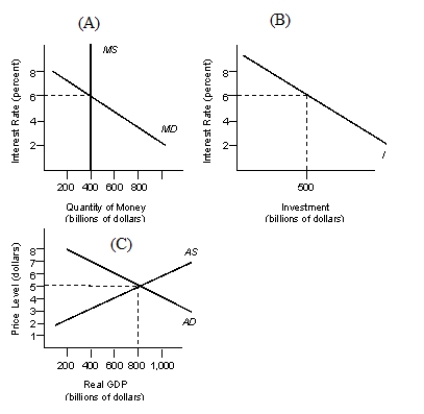
-Refer to Figure 13.3. Other things equal, if the interest rate is greater than 6 percent, then:
Definitions:
Standard Deviation
A measure of the amount of variation or dispersion of a set of values, used in statistics to quantify the spread of data.
Investment Risk
The possibility of losing some or all of the invested capital, with the potential for variability in investment returns.
Strong Form
In the context of efficient market hypothesis, it states that all information, public and private, is completely reflected in stock prices.
Market Efficiency
A concept in financial economics that suggests that asset prices fully reflect all available information.
Q2: According to the traditional classical school of
Q41: Suppose you hold $5,000 in cash when
Q51: If the growth rate of resources is
Q56: If the MPS equals 0.25 and the
Q59: Fiscal policy is most effective in controlling
Q87: Foreign repercussions of changes in domestic spending
Q90: The quantity theory of money asserts that:<br>A)
Q107: Which of the following factors have not
Q114: The transactions demand for money increases when
Q132: A rise in the price level that