Multiple Choice
The figure given below depicts the equilibrium exchange rate between the U.S dollar and the Mexican peso.
Figure 13.2
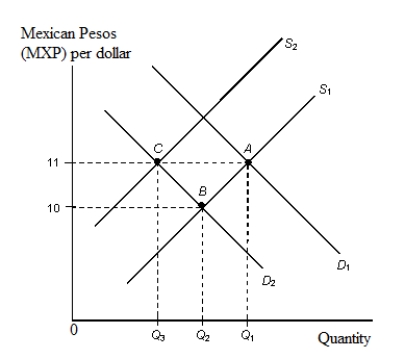
-Refer to Figure 13.2. When the Mexican demand for U.S. dollars rises from D2 to D1 and the relevant supply curve is S1:
Definitions:
Related Questions
Q1: If a household's disposable income increases from
Q9: National debt can be defined as:<br>A) the
Q47: Refer to Figure 13.2. Given a target
Q49: The Keynesian aggregate expenditures model assumes that:<br>A)
Q69: Other things equal, the higher the fiscal
Q80: In the late 1990s, debt-financed government spending
Q100: The Fed usually sets a higher reserve
Q103: The maximum money that can be created
Q125: The equilibrium level of income will rise
Q126: Refer to Table 13.2. If the reserve