The figure given below represents the leakages and injections in an economy.
Figure 10.2
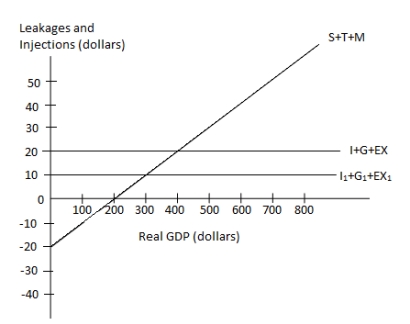 In the figure:
I, I1: Investment;
G: Government spending;
EX, EX1: Exports;
T: Taxes; and
M: Imports.
-Refer to Figure 10.2. When total injections equal $20, the equilibrium level of real GDP is:
Definitions:
Cultural Differences
Cultural differences refer to the diverse customs, beliefs, practices, and social behaviors that vary from one culture or ethnic group to another.
Americanization
The process by which American culture and values are adopted by other countries or people, influencing their way of life, consumption habits, and social norms.
Purchase Behaviors
The actions and decision-making processes of consumers when they buy products or services.
Manufacturing Operations
Processes involved in the production of goods, including designing, machining, assembling, and finishing products.
Q14: According to Table 9.3, what is the
Q15: If one U.S. dollar = 11.76 Mexican
Q31: Which of the following could contribute to
Q36: All of the following would cause exports
Q45: Refer to Figure 9.3. Calculate the marginal
Q49: The emphasis on the greater incentives to
Q60: Autonomous consumption is defined as:<br>A) the domestic
Q104: Refer to Table 10.1. Assume that the
Q124: The Bureau of Labor Statistics defines a
Q127: The quantity of excess reserves in the