The figure given below represents the leakages and injections in an economy.
Figure 10.2
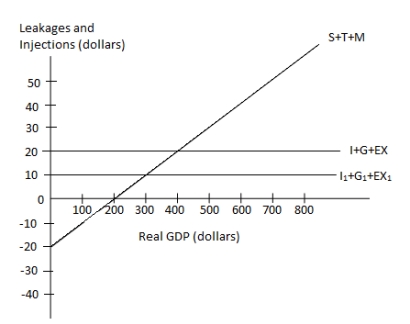 In the figure:
I, I1: Investment;
G: Government spending;
EX, EX1: Exports;
T: Taxes; and
M: Imports.
-According to Figure 10.2, real GDP of $200 indicates a point where:
Definitions:
Discount Date
The date on which a payment is to be made earlier than its originally scheduled due date at a reduced rate.
Due Date
the specified date by which a payment, task, or project is to be completed or submitted.
Delivery Charge
A fee imposed for the service of delivering goods or services to a specified location, typically distinct from shipping charges by the directness of the service.
Purchasing Agent
An individual or entity responsible for buying goods and services for a company or organization.
Q9: Refer to Table 10.4. Suppose the economy
Q28: All members of the Federal Board of
Q49: Aggregate demand represents the _ at alternative
Q54: A decrease in the discount rate:<br>A) increases
Q57: Other things remaining unchanged, the flatter the
Q61: Inflation is defined as the sustained increase
Q69: If a country's imports are very important
Q95: As the general price level in the
Q104: Refer to Table 10.1. Assume that the
Q127: The official unemployment rate is:<br>A) the number