The figure given below represents the macroeconomic equilibrium in the aggregate income and aggregate expenditure framework. Assume that MPI is equal to zero.
Figure 10.4
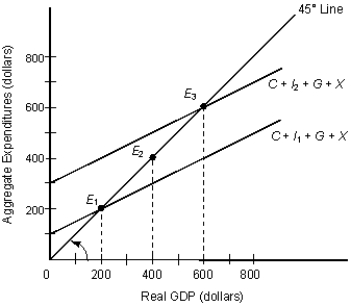 In the figure:
C: Consumption
I1 and I2: Investment
G: Government Spending
X: Exports
-Refer to Figure 10.4. Compute the increase in investment spending from I1 to I2.
Definitions:
Taxpayer
An individual or entity that is obligated to make payments to municipal or government bodies, often in the form of taxes.
Education Expenses
Costs related to education, including tuition, books, and supplies, which may qualify for deductions or credits under tax laws.
Cost Recovery Deduction
Cost Recovery Deduction is a tax deduction that allows individuals or businesses to recover the cost of an investment or asset over time, through depreciation or amortization.
Office Furniture
Items of furniture intended for use in an office environment, including desks, chairs, and filing cabinets.
Q1: Money fails to act as a store
Q13: If a bond pays a fixed return
Q34: The cash reserves held by banks that
Q51: Which of the following statements is true
Q62: Changes in autonomous consumption will affect the
Q75: Ceteris paribus, a decline in the general
Q79: In Figure 9.2, consumption equals disposable income:<br>A)
Q101: The steepness of the aggregate supply curve
Q109: What does it mean if the purchasing
Q115: Credit can be described as:<br>A) money used