The figure given below represents the macroeconomic equilibrium in the aggregate income and aggregate expenditure framework. Assume that MPI is equal to zero.
Figure 10.4
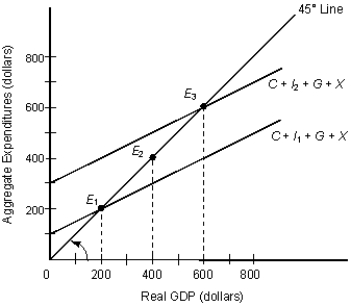 In the figure:
C: Consumption
I1 and I2: Investment
G: Government Spending
X: Exports
-Refer to Figure 10.4. The spending multiplier is _____.
Definitions:
Optimistic Explanatory Style
A tendency to attribute positive events to stable and global causes and negative events to transient and specific causes.
Health Problems
Issues affecting the body or mind that influence overall well-being and functioning.
Actions
Any acts or deeds taken by an individual, which can be observed externally and may be driven by intention, motivation, or external influence.
Seligman
A psychologist best known for his work on learned helplessness, positive psychology, and well-being.
Q1: If a household's disposable income increases from
Q4: The thrift institutions:<br>A) were nonprofit banking institutions.<br>B)
Q6: Suppose the Congress enacts a 5 percent
Q16: In order to achieve an unemployment rate
Q25: Unemployment will decrease over time if:<br>A) actual
Q31: Compared to the government in the typical
Q49: At potential real GDP:<br>A) there is zero
Q67: Refer to Table 9.2. If a firm
Q127: The official unemployment rate is:<br>A) the number
Q136: An excess demand for money will result