The figure given below represents the saving function of an economy.
Figure 9.1
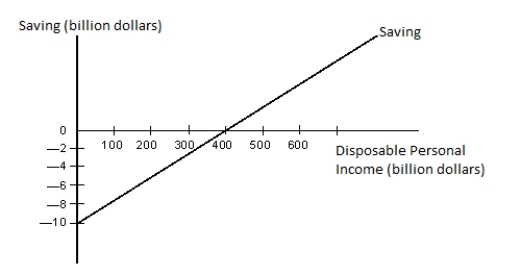
-Refer to Figure 9.1. At the real GDP level of $400 billion, which of the following statements is true?
Definitions:
Negative Excess Reserves
A situation where banks hold less in reserves than what is required by regulations, a condition that could lead to liquidity issues.
Required Reserves
The minimum amount of funds that a bank must hold in reserve against specified deposit liabilities.
Actual Reserves
Actual reserves refer to the total amount of funds that a bank has on deposit at the Federal Reserve bank of its district, plus its vault cash, constituting its total legal reserves.
Fiscal Policy
Governmental policies regarding taxation and spending to influence the economy.
Q2: Other things equal, investment spending will increase
Q8: Foreign aid, royalties earned abroad, and long-term
Q11: When inflation is much higher than expected,
Q23: Assume that an American investor decides to
Q25: Under the system of fractional reserve banking,
Q44: A variable-rate mortgage:<br>A) eliminates the risk of
Q59: Fiscal policy is most effective in controlling
Q74: Other things equal, an increase in the
Q74: The Wall Street Journal publishes an exchange
Q102: The total expenditure on goods and services