Multiple Choice
The figure given below represents the long-run equilibrium in the aggregate demand and aggregate supply model.
Figure 8.2
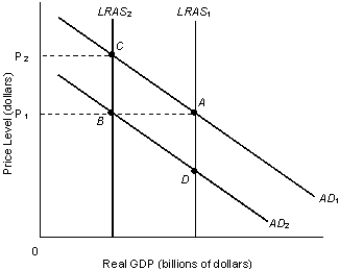
-Refer to Figure 8.2. A movement from equilibrium point A to equilibrium point B would be the result of a(n) :
Definitions:
Related Questions
Q21: The net balance on the balance of
Q22: Suppose the reserve requirement is 10 percent
Q24: When capacity utilization rate is high:<br>A) the
Q45: The _ is the difference between potential
Q50: The recessionary gap is given by the
Q62: Changes in autonomous consumption will affect the
Q95: In most derivations of the aggregate expenditures
Q99: According to the permanent income hypothesis, when
Q104: Aggregate demand-aggregate supply analysis shows that in
Q109: Assume that the AD curve is held