The figure given below represents the equilibrium real GDP and price level in the aggregate demand and aggregate supply model.
Figure 8.3
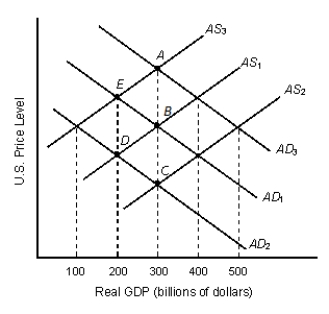
-Refer to Figure 8.3. If AS1 and AD1 represent the initial aggregate demand and supply in the economy, the long-run equilibrium real GDP will be _____ billion.
Definitions:
Sales Forecasts
The process of estimating future sales. It helps businesses make informed decisions regarding inventory management, workforce needs, and financial planning.
Historical Trends
Analysis of past data to identify patterns or changes over time that may influence future outcomes or behaviors.
Economic Forecasts
Predictions about future economic conditions, including growth rates, inflation, and employment, based on current and historical data.
FA/Sales Ratio
Fixed Assets to Sales Ratio; measures the efficiency of a firm's use of its fixed assets to generate sales.
Q12: Ricardian equivalence can be said to hold
Q20: Which of the following constitutes a transfer
Q24: When capacity utilization rate is high:<br>A) the
Q56: Markets in which the currencies of different
Q63: A balanced budget would not affect income
Q64: The interest rate effect states that an
Q80: A key assumption of the Keynesian model
Q90: Which of the following will be categorized
Q97: Which of the following countries did not
Q98: Indonesia experienced hyperinflation in the 1990s.