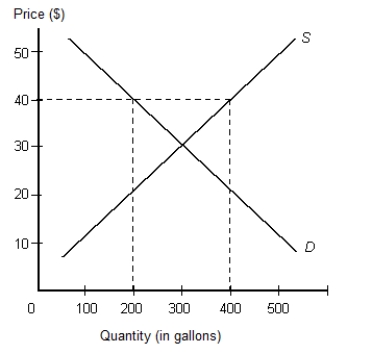
The below figure shows the demand and supply curves in the market for gasoline. The price and quantity at the point of intersection of the demand and supply curves is $30 and 300 gallons respectively.Figure 3.6

-Assume that the market for gasoline in Figure 3.6 is in equilibrium. What is the most likely consequence of a government-imposed price ceiling at $10 per unit?
Definitions:
Good A
A placeholder term that typically represents a general or unspecified item in economic models or discussions.
Good B
A term representing a specific product or service under consideration in an economic model or market analysis.
Marginal Utility
The increased fulfillment or advantage obtained by using one more unit of a good or service.
Bundle A
Not a standardized economic term without context; appears to be a placeholder name for a specific set of goods and services.
Q9: State which number on the number line
Q23: Write the number <span class="ql-formula"
Q23: To say that "there is a scarcity
Q27: If an individual can produce a good
Q32: Without money, no transaction can occur.
Q34: A patient on a diet records monthly
Q39: Which of the following best describes a
Q56: Divide: (-78) <span class="ql-formula" data-value="\div"><span
Q74: Refer to Table 5.3. The value added
Q99: A person obtains income is obtained by