The circle graph shows the budget allocation for the Griner family's income. The annual family income is $125,000. Find the amount of money budgeted annually for vehicle and housing and utilities. 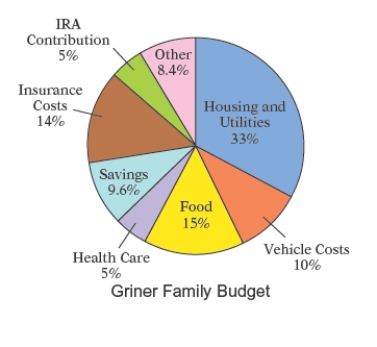
Definitions:
Alpha Levels
A threshold value that determines the significance level of a statistical test, representing the probability of rejecting a true null hypothesis (committing a Type I error).
Two-tailed Test
A statistical test that considers the possibility of both positive and negative differences or effects.
Research Hypothesis
A specific and testable prediction about the relationship between two or more variables.
Alternative Hypothesis
A hypothesis that contradicts the null hypothesis, suggesting that there is a statistical effect or a significant difference in the population.
Q1: The heart of the economic problem is
Q28: During a quality control test, The
Q28: According to the National Sample Survey of
Q34: The circle graph shows a breakdown,
Q74: What is -16 more than -6?<br>A) -11<br>B)
Q93: Multiply: -13 . (0)<br>A) 13<br>B) -7<br>C) -13<br>D)
Q94: Add: 5.66 + 74.2 + 4.299<br>A) 86.17<br>B)
Q106: Divide: <span class="ql-formula" data-value="927.531 \div
Q114: Write the number 4,700,000,000,000 in scientific
Q123: A home-health nurse purchased medical supplies for