The bar graph below shows the regions in which all the passenger cars were produced during a recent year. What is the difference between the number of passenger cars produced in Western Europe and the number produced in Eastern Europe/Russia? 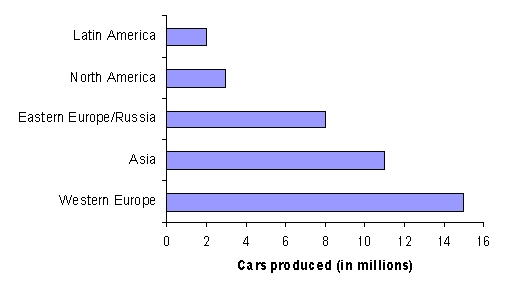
Definitions:
Scheduling
The process of arranging, controlling, and optimizing work and workloads in a production process or manufacturing process.
Log-Log
A logarithmic scale used on both the x-axis and y-axis of a graph, often to display data covering a wide range of values.
Production Rate
The speed at which goods are manufactured or produced in a given period of time.
Constant Value Dollars
An accounting method that adjusts for inflation to preserve the purchasing power of the currency over time.
Q1: A roll of surgical tape is 2.3
Q8: Round 65.80004 to the nearest thousandth.<br>A) 65.800<br>B)
Q12: A nurse's aide records the amount
Q17: A child's temperature was 101.4°F during a
Q32: Subtract: <span class="ql-formula" data-value="0.66"><span class="katex"><span
Q39: For an analysis to be considered positive,
Q44: The chart below shows the closing price
Q45: A nurse's aide records the amount
Q70: A good or service becomes scarcer over
Q70: Write the mixed number <span