Multiple Choice
Given the graph of below, determine which of the following graphs represents . 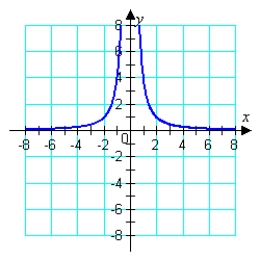
Definitions:
Related Questions
Q5: A hunting club stocks a wildlife
Q6: Assets show the results of the organization's
Q10: Estimate the percentage of radioactive material that
Q12: The number of new privately-owned housing
Q24: Find the limit: <span class="ql-formula"
Q25: Use long division to divide.
Q30: If possible, find 4A + 5B.
Q43: Use the functions given by
Q76: The _ is a snapshot of the
Q109: can be controlled by comparing how much